The following article is contributed by Pete from Weekly Market Reports, an independent macro research publisher.
The US Treasury yield curve this week is steep, but the steepness is not a simple signal of a normal expansion. This week, the 2Y sits at 4.51% and the 10Y at 4.86%, so the 2Y-10Y slope is +0.350% and the 10Y-30Y slope is +0.400%. The shape looks familiar, yet the forces behind it are split. The front end is anchored by policy expectations, while the long end is still carrying fiscal and corporate supply pressure.
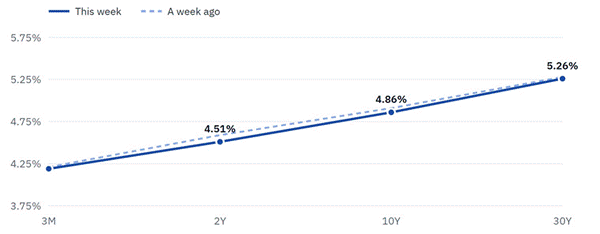
Chart 1. The US Treasury yield curve this week against a week ago. Source: Weekly Market Reports.
Policy Anchor at the Front End
The short end has not softened in a way that would suggest a quick turn in rates. The 3 Month yield stands at 4.19%, with a weekly change of -0.02%, while the 2Y stands at 4.51%, with a weekly change of -0.08%. The 3M-2Y slope is +0.320%. That gap is positive, but it is narrow enough to show that the market is not pricing a rapid easing path.
The Fed under Chair Warsh is framed as being in hiking mode. CPI is 3.7% y/y and Q3 GDP is 3.4%. The October jobs print of 165K added to that picture, lifting December-hike odds to around 70-80%, with a move from 70% to 78%. The practical effect is that the 2Y remains sticky. It is not behaving like a yield that is drifting lower on near-term rate-cut hopes. It is behaving like a yield that is pinned by the expectation that the Fed will act in December.
Long-End Relief, Not Long-End Normal
The belly and long end have moved more than the front end. The 10Y stands at 4.86%, with a weekly change of -0.05%, while the 30Y stands at 5.26%, with a weekly change of -0.02%. The 10Y has pulled back from an October 5.36% peak and from 5.28% a month earlier. The 30Y has moved from 5.67% to 5.26%. The 10Y has also fallen 13 basis points to 4.83% since Tuesday.
That move is meaningful, but it is a relief move, not a reset. The easing is tied to the Democratic sweep in the Nov 3 midterms, which shifted the fiscal narrative toward gridlock and reduced near-term spending expectations. Oil disinflation is also part of the picture. The long end has eased because the market is pricing less near-term fiscal expansion, not because the deeper fiscal problem has disappeared.
The structural story is still visible in the levels. A >$40T national debt and AI-linked corporate borrowing keep a floor under long rates. The 10Y at 4.86% and the 30Y at 5.26% remain high enough to show that the long end is still absorbing risk, even after the tactical rally.
Why the Spread is the Better Read
The most useful part of the curve is not any single yield, but the spread between yields. The 2Y-10Y slope at +0.350% says the market is demanding a meaningful premium for holding longer-dated Treasuries. The 10Y-30Y slope at +0.400% says that demand is even stronger at the very long end. The curve is fully dis-inverted and steep, but it is not a standard healthy expansion curve.
That distinction matters. A normal steep curve can be read as a market expecting growth and higher rates over time. This curve is more bifurcated. The short end is constrained by sticky inflation and a hawkish Fed. The long end is shaped by fiscal mechanics and supply-side shocks. The slope is the gap between those two different risks.
Record corporate bond issuance by AI builders is part of that long-end story. Magnificent Seven debt is up 45% to $578B by mid-2026. AI debt to 2027 is 29% of new Treasury notes and bonds, and the AI complex now owes $340-400 billion to the market. Those figures help explain why the long end can stay elevated even after a fiscal-restraint rally. The long end is not only pricing government debt. It is also pricing the crowding-out effect of large corporate issuance.
What the Shape is Not Saying
The curve is not saying that the December hike is in doubt. The 2Y at 4.51% is sticky, and the hike is treated as near-certain. The 2Y dropped only 8 basis points over the last week, which is small compared with the larger monthly move in the belly. That stickiness keeps the front end anchored in a higher-for-longer reality.
The curve is also not saying that the long end has returned to normal. The 10Y at 4.86% and the 30Y at 5.26% remain structurally elevated. The 10Y-30Y slope at +0.400% shows that investors are still asking for a large term premium. The midterm result changed the near-term fiscal tone, but it did not remove the deeper debt and supply issues.
For a reader watching the curve, the slope is doing more work than the levels. The 2Y-10Y spread at +0.350% shows a hawkish short end and a supply-heavy long end at the same time. The 10Y-30Y spread at +0.400% shows that the long end is still absorbing fiscal and corporate supply. The curve is steep, but the steepness is not a simple vote for growth. It is a map of two risks: policy at the front, fiscal plus supply at the back.
Pete writes for Weekly Market Reports, an independent macro research publisher; its weekly Yield Curve report is free at weeklymarketreport.com/yield-curve.
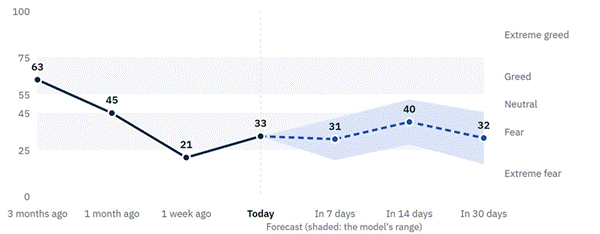
Chart 2. Our Fear & Greed index: the reading and the model’s forecast. Source: Weekly Market Reports.